I’m trying to build an app that looks at biological data, and I created a dropdown menu that allows multiple options to be selected. Now I want to be able to see where those options are stored, and how to use them. I’ve pasted the code, and what I want to do with it. If someone could help, it would be greatly appreciated as I’m stuck and don’t know how to continue:
-
I want to select whatever genes from the “PCR Positive” drop down menu on page 2 (this works)
-
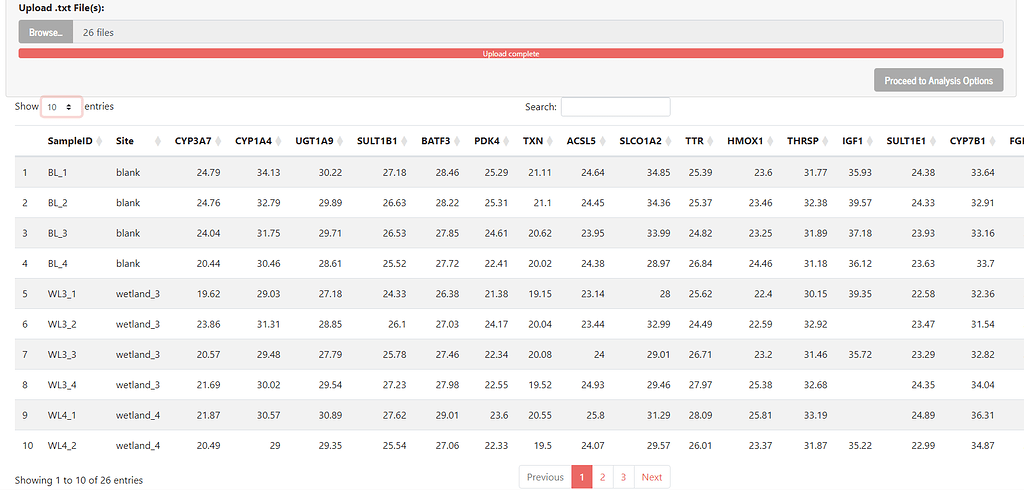
After selecting the genes, I would like it to take all of that gene’s values from the table on page 1 (the table appears after uploading certain files, I’ve attached a photo of the table)
-
Those values are saved/stored as a separate output, and can then be assessed whether they pass the conditions for the PCR Positive Control row on page 3 in the QC summary
-
If all the samples pass, then “PASS” is displayed. If any of the samples fail, “FAIL” is displayed. The result is dependent on whether the Ct value is greater/lower than the selected “High Ct Cutoff” on page 2
-
The failed samples are displayed in the “Failed PPC Samples” at the bottom of page 3, with the Sample ID being the string in the “SampleID” column of page 1’s table, the Gene Name being the name of the gene selected from page 2 (column name, PPC in this specific case), and Ct being the value for that gene in page 1’s table
Code:
library(tidyverse)
library(readxl)
library(shiny)
library(bslib)
library(data.table)
UI
ui <- fluidPage(
titlePanel(“QPCR App”),
theme = bs_theme(version = 4, bootswatch = “journal”),
tabsetPanel(
id = “switch”,
tabPanel("Import Data",

         fluidRow(
           column(width = 12,
                  sidebarPanel(
                    style = "height: 350px",
                    width = 16,

                    actionButton("instrButton", "Instructions", style = "background-color: black; color: white;"),
                    br(),
                    br(),

                    fileInput("metaFile", strong("Upload metadata.xlsx File:"),
                              accept = c(".xlsx")),

                    fileInput("dataFiles", strong("Upload .txt File(s):"),
                              accept = c(".txt"),
                              multiple = TRUE),
                  fluidRow(
                    column(width = 12, align = "right",
                    actionButton("page_12", "Proceed to Analysis Options")
                  )
                )
               ),

           )
         ),

         mainPanel(
           DT::dataTableOutput("fullTable")
         )
),

tabPanel("Analysis Options",
         sidebarLayout(
           sidebarPanel(
             column(12,
                    selectInput("sfactors", label = strong("Select Factors"),
                                choices = NULL, multiple = TRUE)
             ),


             column(12,
                    selectInput("sHK", label = strong("Select House Keeping Genes"),
                                choices = NULL, multiple = TRUE),
                    actionButton("reset", "Reset")
             ),

             fluidRow(
               column(6,
                      selectInput("sGC", label = strong("Genomic Contamination"),
                                  choices = NULL, multiple = TRUE)),

                 column(6,
                      selectInput("sPP", label = strong("PCR Positive"),
                                    choices = NULL, multiple = TRUE)),
                    ),


              fluidRow(
                column(6,
                    selectInput("sRTC", label = strong("Reverse Transcriptase Control"),
                                      choices = NULL, multiple = TRUE)),

                column(6,
                    selectInput("sNTC", label = strong("No Template Control"),
                                        choices = NULL, multiple = TRUE)),
                     ),

             fluidRow(
               column(6,
                      numericInput("lowCT", label = strong("Low CT Cutoff"), value = 1, min=1, max=15)),

               column(6,
                      numericInput("highCT", label = strong("High CT Cutoff"), value = 25, min=25, max=40)),
             ),


             fluidRow(
             column (6, actionButton("page_21", "Return to Import Data"), align = "left"),
             column (6, actionButton("page_23", "Proceed to QC Report"), align = "right"),
             )

             ),

           mainPanel(),
         ),
),

tabPanel("QC Report",

         h3("QC Summary"),
         mainPanel(tableOutput("RTable")),

         h3("QC Details"),

         h5("Failed PPC Samples"),
         mainPanel(tableOutput("FPPCTable")),

         h5("Failed RTC Samples"),
         mainPanel(tableOutput("RTCTable")),

         h5("Failed NTC Samples"),
         mainPanel(tableOutput("NTCTable")),

         h5("Failed GCC Samples"),
         mainPanel(tableOutput("GCCTable")),

         actionButton("page_32", "Return to Analysis Options")
)
)
)
SERVER
server <- function(input, output, session) {
observeEvent(input$instrButton, {
showModal(modalDialog(
title = “Instructions”,
p(“Input 1: Upload a metadata.xlsx file with 3 columns (SampleID, Type, Control)”),
p(“Input 2: Upload .txt files that match the name in metadata’s SampleID column. Each .txt file has to contain ‘Well Name’ and ‘Ct (dRn)’ columns”),
easyClose = TRUE,
footer = tagList(
actionButton(“instrCloseButton”, “Close”, style = “background-color: black; color: white;”)),
size = “l”,
))
observeEvent(input$instrCloseButton, {
removeModal()
})
})
switch_page <- function(tab_name) {
updateTabsetPanel(inputId = “switch”, selected = tab_name)
}
observeEvent(input$page_12, {switch_page(“Analysis Options”)})
observeEvent(input$page_21, {switch_page(“Import Data”)})
observeEvent(input$page_23, {switch_page(“QC Report”)})
observeEvent(input$page_32, {switch_page(“Analysis Options”)})
metaData <- reactive({
req(input$metaFile)
read_excel(input$metaFile$datapath)
})
#load geneData
geneData <- reactive({
req(input$dataFiles)
rawList<-list()
for(i in 1:nrow(input$dataFiles)) {
lname<-gsub(“.txt”, “”, input$dataFiles$name[i])
rawList[[lname]] <- read.table(file = input$dataFiles$datapath[i], header = TRUE, sep=”\t”, stringsAsFactors = FALSE, check.names=FALSE, na.strings = “No Ct”)
rawList[[lname]] <- rawList[[lname]][c(“Well Name”,”Ct (dRn)”)]
colnames(rawList[[i]])[2] <-lname
}
combData<- reduce(rawList, left_join, by = ‘Well Name’)
})
fullTable<-reactive({
# Move gene names into row names so that they become column names when we transform table
tempGeneData <- geneData()
rownames(tempGeneData)<-tempGeneData$'Well Name'
tempGeneData <- tempGeneData %>%
  dplyr::select(-'Well Name') %>%
  t()

# Move "sample IDs" (which are currently the new row names) into a column called "SampleID"
tempGeneData <- data.frame(SampleID=rownames(tempGeneData), tempGeneData)

# join with metaData
fullData <- inner_join(metaData(), tempGeneData, by="SampleID")
})
observeEvent(metaData(), {
choices <- colnames(metaData())
updateSelectInput(inputId = “sfactors”, choices = choices)
})
observeEvent(geneData(), {
choices <- geneData()$’Well Name’
updateSelectInput(inputId = “sHK”, choices = choices)
})
observeEvent(input$reset, {
# Reset the selected options by setting choices to an empty set
updateSelectInput(inputId = “sHK”, selected = character(0))
})
input_ids <- c(“sGC”, “sPP”, “sRTC”, “sNTC”)
update_select_input <- function(input_id) {
observe({
choices <- c(“None”, geneData()$’Well Name’)
updateSelectInput(session, input_id, choices = choices)
})
}
lapply(input_ids, update_select_input)
output$fullTable<-DT::renderDataTable({
fullTable()
})
#Page 3 Tables
RTable <- reactive({
highCT <- input$highCT
tibble(
  "Control Type" = c("PCR Positive Control",
                     "Reverse Transcription Control",
                     "No Template Control",
                     "Genomic Contamination Control"),

  "Purpose" = c("To test if your PCR reactions worked",
                "To test if your RT reactions worked",
                "Checks for RNA Contamination",
                "Checks for DNA Contamination"),

  "Pass Criteria" = c("Ct < High Ct Cutoff",
                      "Ct < High Ct Cutoff",
                      "Ct > High Ct Cutoff or No Ct",
                      "Ct > High Ct Cutoff or No Ct"),

  "Result" = c("NA") #make QC Detail tables first, and just have the Result display everything (don't need to have it test things here)
)
})
output$RTable <- renderTable({
RTable()
})
detailTable <- reactive({
tibble(
“Sample ID” = c(“NA”),
“Gene Name” = c(“NA”),
“Ct” = c(“NA”))
})
output$FPPCTable <- renderTable({
detailTable()
})
output$RTCTable <- renderTable({
detailTable()
})
output$NTCTable <- renderTable({
detailTable()
})
output$GCCTable <- renderTable({
detailTable()
})
}
Run the app
shinyApp(ui = ui, server = server)
Table 1 Image:
