If you’re planning a trip to Iceland, you’ve probably heard that in addition to northern lights and the magical midnight sun, it’s also famous for unpredictable weather. Constantly keeping the Icelandic people on their toes, it can change directions in an instant, sometimes even going so far as to offer all four seasons in a single day. Despite this uncertainty, staying up to date with the forecast is an important part of keeping yourself safe and comfortable. It allows you to plan ahead for packing, and travel-wise prevents you from getting caught in potentially dangerous situations. The Icelandic Met Office forecast, available on their website and app, is the best place to check. It provides detailed and up-to-date information about the expected weather and alerts you to extreme conditions. Below, you will find everything you need to know about what you can expect from the weather in Iceland and how to read the weather report.
What’s the weather like in Iceland?
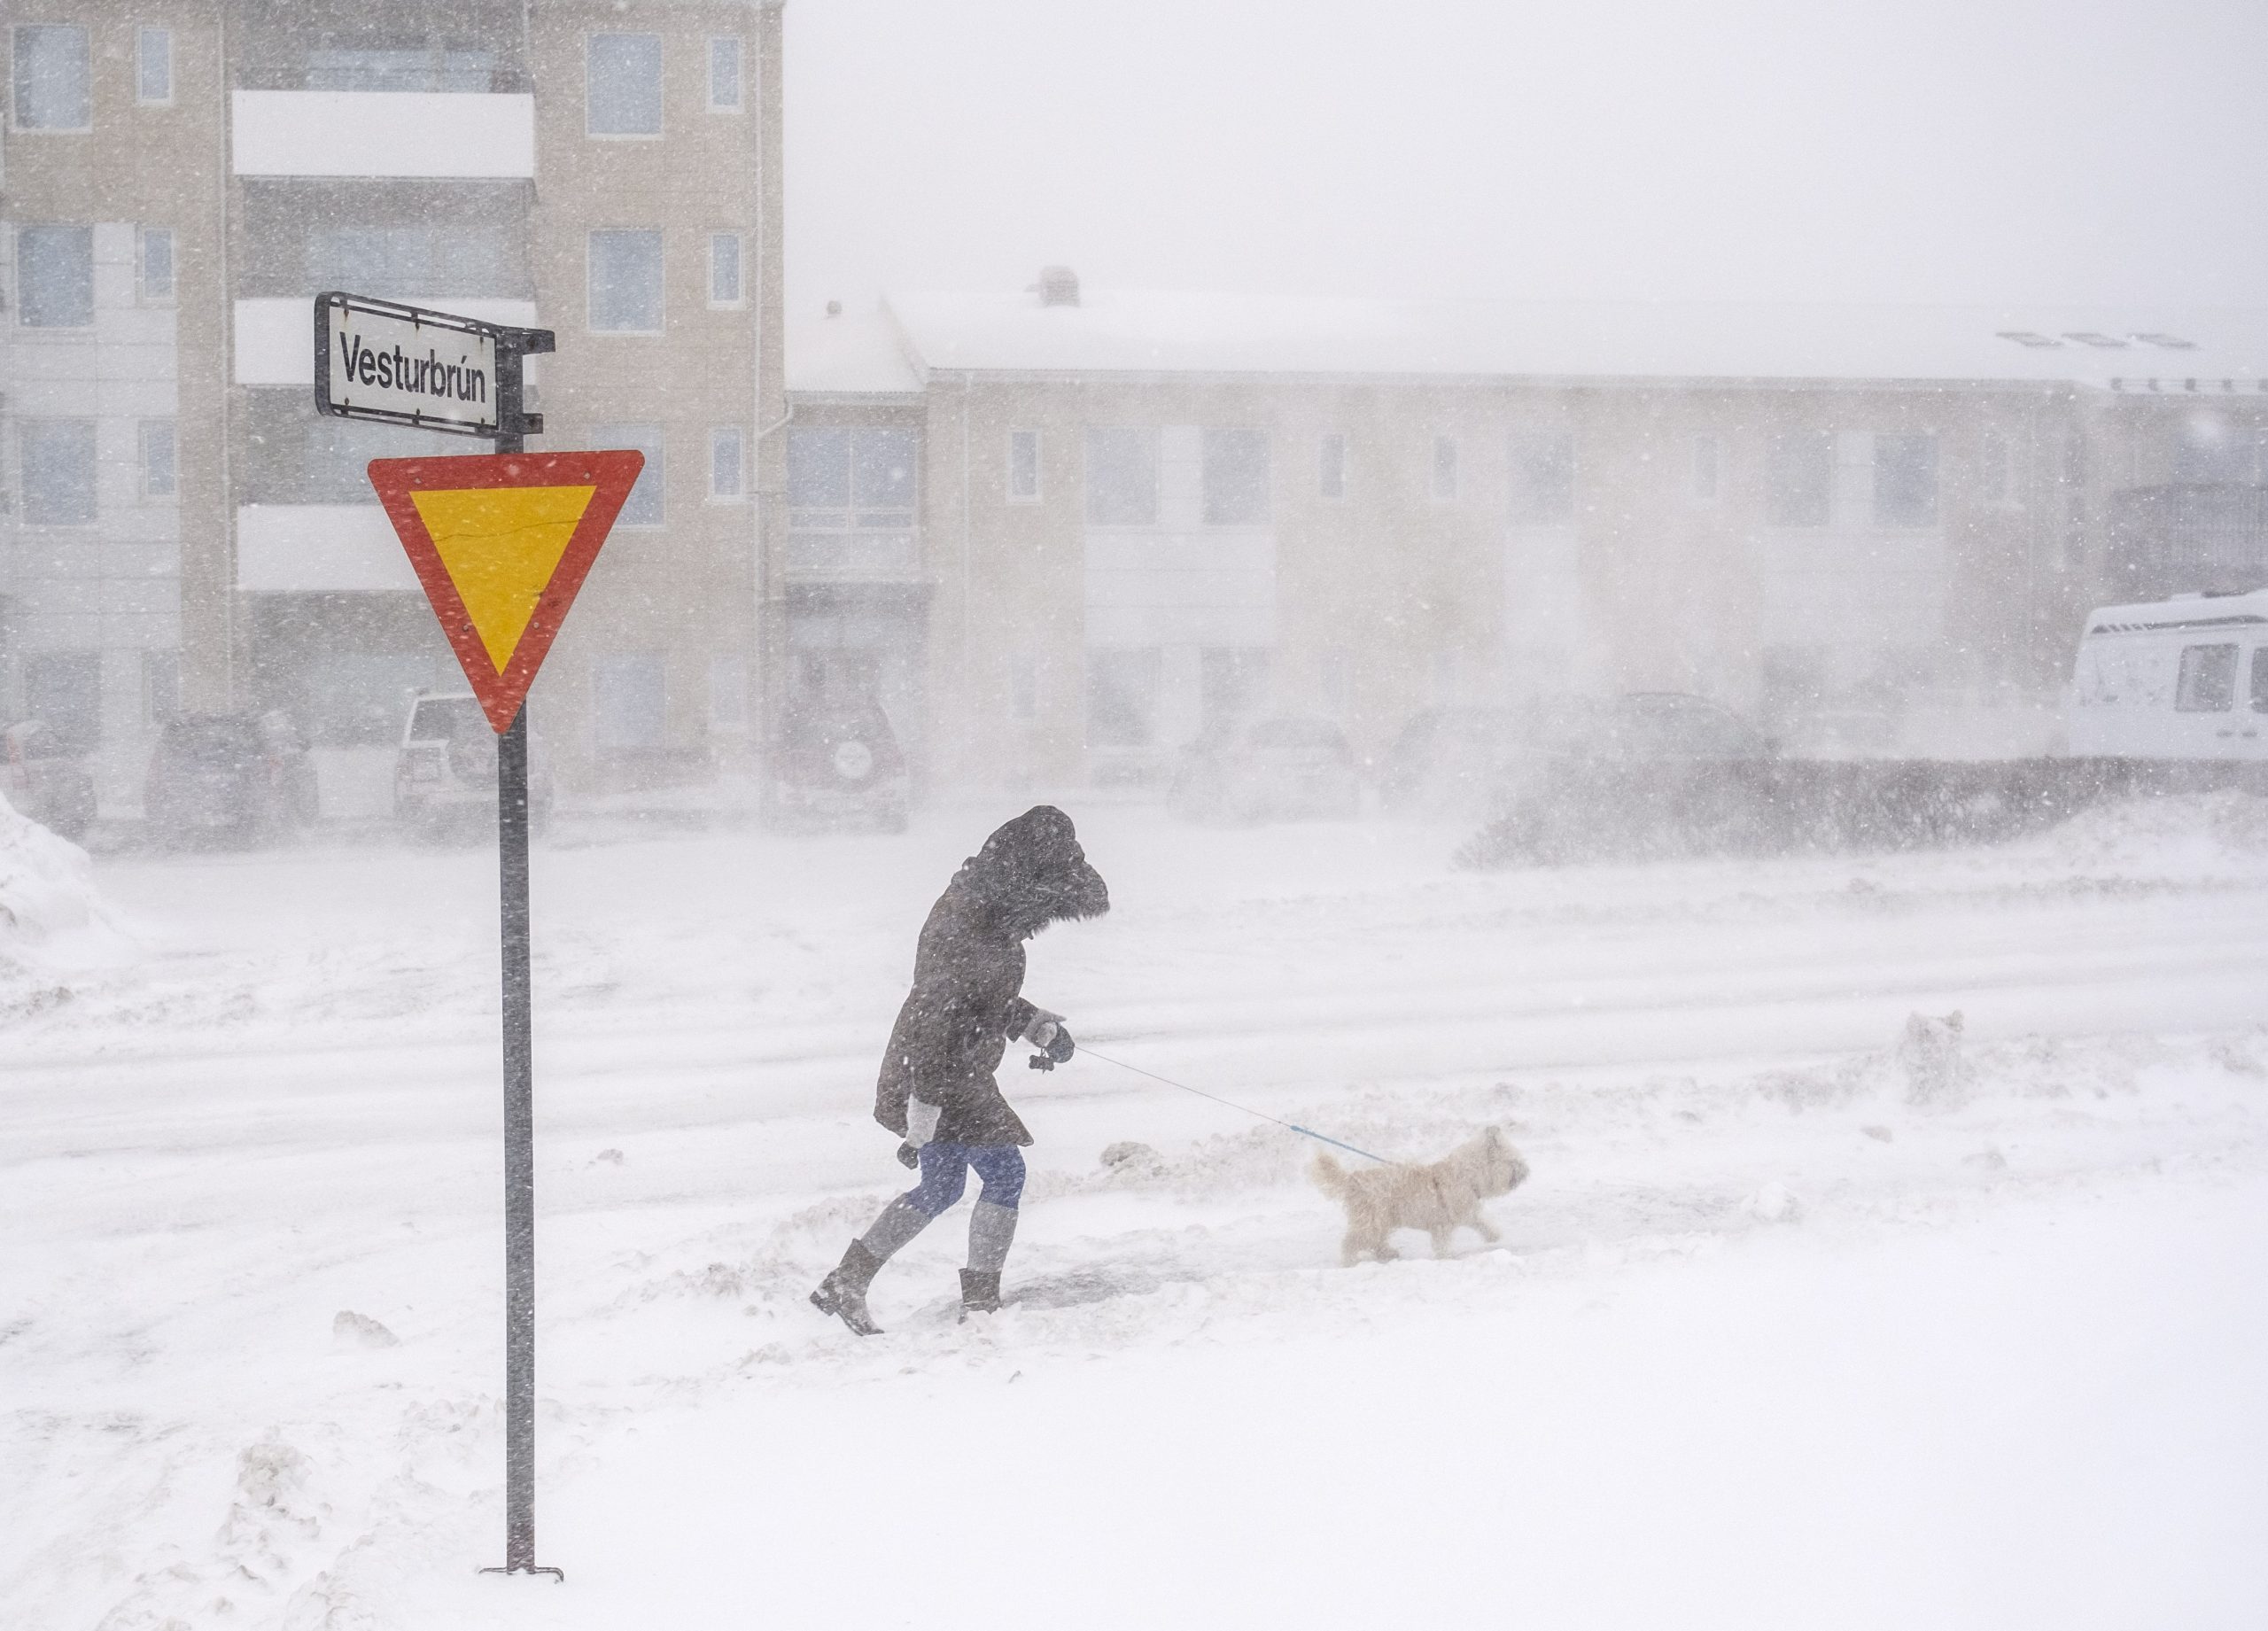
Generally, temperatures fluctuate between -10 °C [14 °F] and 20°C [68°F] over the year, with January being the coldest month and July the warmest. Storms, often accompanied by snow or rain, are frequent from September to March but far less common during summer.
This is not to say that the weather in Iceland is all storms and rain that slaps you in the face. The fall and winter days can be quite beautiful, with clear skies and frosty ground or snow that falls calmly to the ground, and the spring and summer usually offer some exceptional days of sun and warmth as well.
Given this unpredictability, it’s imperative for your safety and comfort that you check the weather forecast a few days before your trip and stay informed throughout it. The weather often catches people off guard, leaving them cold and uncomfortable, a situation that can easily be avoided by checking the forecast and dressing in the right clothes. Likewise, knowing when extreme weather is expected can spare you from getting yourself into a potentially dangerous situation, such as driving on a mountain road in a blinding snowstorm.
Weather alerts
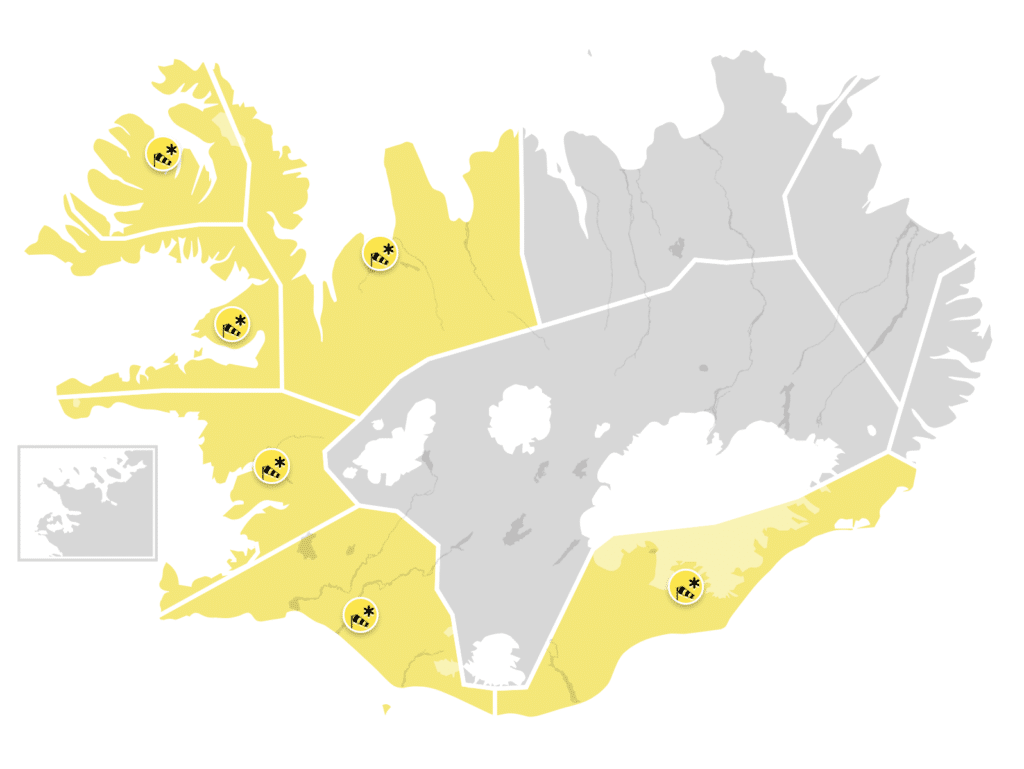
The most important thing to know about the Icelandic weather report is how the colour-coded alert system works. Alerts are issued in cases of extreme weather and are a convenient way to quickly get the lay of the land. As mentioned above, snowstorms, rainstorms, and windstorms are common during fall and winter, and keeping an eye out for alerts is essential for your safety. They are less common during spring and summer, but we advise you to check for them nonetheless, especially if you’re driving around the country or going up to the Highland.
The alert system is simple and easy to understand. It has three colours, each representing a different severity level: yellow, orange, and red. You’ll see the warnings in the top right corner of the Icelandic Met Office homepage. There’s a small blue map of Iceland there which will display the different colours in correspondence with the weather in each part of the country – north, west, south, east, and the Highland. You can click on each section of the country to get more specific information about the issued warnings, what they entail and where they apply.

A yellow alert is the least extreme, and although it probably won’t be pleasant to spend the day outside, you can usually go about your business uninterrupted. Just be mindful of wind gusts and things that might be blowing around. If you had a hike planned, you should postpone it to another day, as the weather is usually more extreme in the mountains. You should also be extra careful driving around, especially in the countryside. Wind gusts can easily catch you off guard if you’re not prepared for them, leading to accidents.
An orange alert means that the weather can be dangerous, and people are advised not to take unnecessary trips outside. A red alert is the most extreme, indicating a level of emergency. It’s relatively uncommon that a red alert is issued, but in case you encounter one while you’re here, prepare to kick back and have a cosy day inside. You should only leave the house in case of emergencies.
For all stages of alerts, it’s important to be mindful of your surroundings and take caution when moving around, both on foot and in a car. If you’re staying in a home with a patio, balcony, or garden, and there is any furniture or other loose items, secure them so they won’t blow away. You could, for example, move the items inside or stack them in a sheltered corner. Any level of alert could result in cancelled trips, delays in transportation, and closed roads.
If the map in the upper right corner is entirely blue, there is no warning, and you can proceed with your plans uninterrupted.
The classic weather map
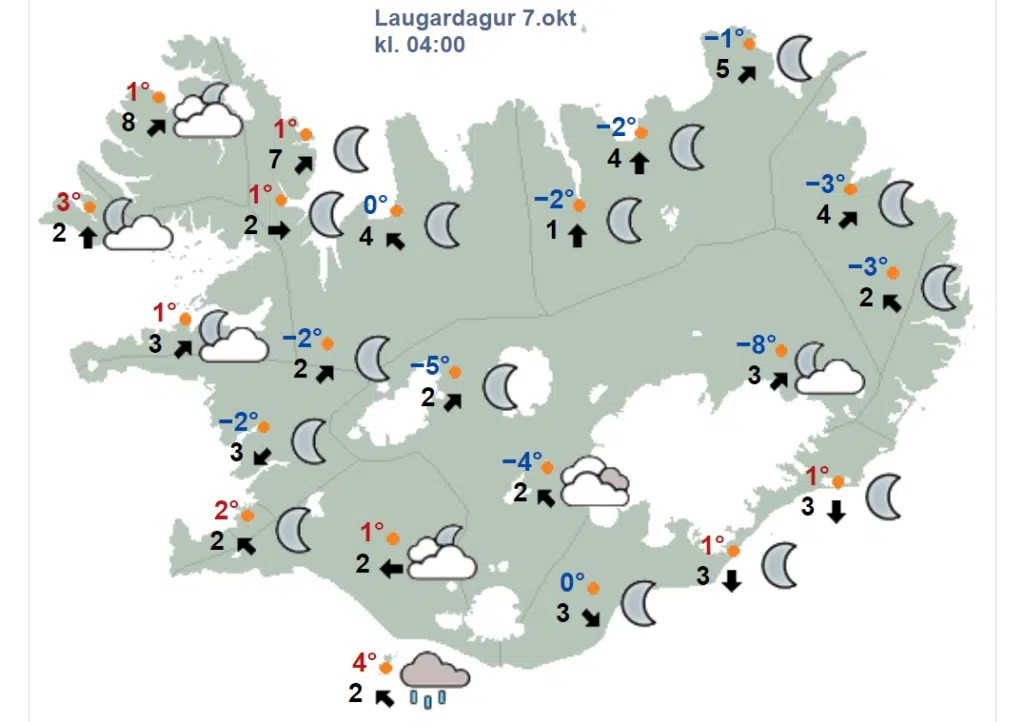
To get a closer look at the weather, you can check out the map labelled ‘whole country’. It’s a classic weather report map using sun and cloud symbols to display the expected weather – sunny, cloudy, rainy, snowy. Temperature is shown in Celsius beside the symbols, with a red number if it’s above freezing and a blue one if it’s below. Wind predictions are displayed as meters per second, with an arrow indicating the wind direction. Both the number and the arrows are black.

Use the sliding bar below the map to move back and forth in time, and click on the map to zoom in. Doing so will also give you more locations to look at. By hovering over a sun/cloud symbol, you’ll get basic written information about the weather in that location, and by clicking on it, a six-day forecast for the area will appear below the map.
In-depth weather report
In addition to the typical forecast map, you can find separate maps for temperature, wind, and precipitation predictions. These are colour-coded and more specific than the all-in-one map.
The wind map shows the expected wind at 10 metres [33 feet] height. The arrows across the map indicate the direction of the wind, and the colours indicate speed. Green tones represent a wind speed of 0-8 metres per second, blue tones 8-16, purple tones 16-24, and red tones anything above that.
The temperature map shows the expected temperature at two metres [6.6 feet] height. The lowest temperatures are shown in green tones, each tone representing 2°C temperature intervals. As the heat increases, the colour tones will change to blue, yellow, orange, and red, with red representing the highest temperatures.

The precipitation map shows the cumulative precipitation levels over a 1-hour, 3-hour or 6-hour period. The colours range from light yellow, indicating light precipitation of 0.1 mm [0.004 inches] per hour, to red, indicating heavy precipitation of 50 mm [2 inches] per hour. The map will also show you the direction and speed of the wind with wind barbs, the point of which will tell you the direction of the wind. Diagonal lines at the end of the barb symbolise wind speed. An increase in the length and number of lines means stronger winds. If the wind reaches 25 m/s, a triangle will be at the barb’s end. The lines across the map indicate mean sea level pressure.
The wind, temperature, and precipitation maps all have the same sliding bar function as the basic map, but you cannot zoom in on it or choose specific locations.
